Some extra stats from specific OSD
Here is an example of a command I occasionally use to analyze the usage of an OSD. This could helps summarize BYTES, OMAP_BYTES, and the number of objects on a specific OSD using the ceph pg dump command. It is particularly useful for diagnosing OSD usage in environments with multiple pools, custom distributions, or various device classes.
The command
OSD_ID=5

[[ -v OSD_ID ]] && (ceph osd pool ls detail; ceph pg ls-by-osd ${OSD_ID}) | awk '
BEGIN { IGNORECASE = 1 }
/^pool [0-9]+ / { poolNAME[$2]=$3 }
/^PG/ {
  colBYTES=1; while($colBYTES!="BYTES") {colBYTES++}
  colOMAP=1; while($colOMAP!="OMAP_BYTES*") {colOMAP++}
  colOBJECTS=1; while($colOBJECTS!="OBJECTS") {colOBJECTS++}
}
/^[0-9]+\.[0-9a-f]+/ {
  match($0,/^[0-9]+/);
  pool=substr($0, RSTART, RLENGTH);
  poolBYTES[pool]=poolBYTES[pool] + $colBYTES;
  poolOMAP[pool]=poolOMAP[pool] + $colOMAP;
  poolOBJECTS[pool]=poolOBJECTS[pool] + $colOBJECTS;
  poolPG[pool]=poolPG[pool]+1
}
END {
  for (i in poolBYTES) {
    poolBYTESsum+=poolBYTES[i]
    poolOMAPsum+=poolOMAP[i]
    poolOBJECTSsum+=poolOBJECTS[i]
    poolPGsum+=poolPG[i]
  }
  printf("\033[1m%-116s---------------------------- PER PG ----------------------------\033[0m\n", "")
  printf("\033[1m%-50s %-14s %-6s %-14s %-6s %-14s %-6s %-8s %-14s %-6s %-14s %-6s %-14s %-6s\033[0m\n", "POOL", "BYTES", "(%)", "OMAP_BYTES", "(%)", "OBJECTS", "(%)", "PG", "BYTES", "(%)", "OMAP_BYTES", "(%)", "OBJECTS", "(%)")
  for (i in poolBYTES) {
    poolBYTESperPG = ( poolPG[i] == 0 ) ? 0 : poolBYTES[i]/poolPG[i]
    poolOMAPperPG = ( poolPG[i] == 0 ) ? 0 : poolOMAP[i]/poolPG[i]
    poolOBJECTSperPG = ( poolPG[i] == 0 ) ? 0 : poolOBJECTS[i]/poolPG[i]
    poolBYTESpercent = ( poolBYTESsum == 0 ) ? 0 : poolBYTES[i]/poolBYTESsum * 100
    poolOMAPpercent = ( poolOMAPsum == 0 ) ? 0 : poolOMAP[i]/poolOMAPsum * 100
    poolOBJECTSpercent = ( poolOBJECTSsum == 0 ) ? 0 : poolOBJECTS[i]/poolOBJECTSsum * 100
    poolBYTESpercentPG = ( poolBYTESsum == 0 ) ? 0 : poolBYTESperPG/poolBYTESsum * 100
    poolOMAPpercentPG = ( poolOMAPsum == 0 ) ? 0 : poolOMAPperPG/poolOMAPsum * 100
    poolOBJECTSpercentPG = ( poolOBJECTSsum == 0 ) ? 0 : poolOBJECTSperPG/poolOBJECTSsum * 100
    printf("%-50s %-14i \033[1m%-6.2f\033[0m %-14i \033[1m%-6.2f\033[0m %-14i \033[1m%-6.2f\033[0m %-8i %-14i \033[1m%-6.2f\033[0m %-14i \033[1m%-6.2f\033[0m %-14i \033[1m%-6.2f\033[0m\n", poolNAME[i], poolBYTES[i], poolBYTESpercent, poolOMAP[i], poolOMAPpercent, poolOBJECTS[i], poolOBJECTSpercent, poolPG[i], poolBYTESperPG, poolBYTESpercentPG, poolOMAPperPG, poolOMAPpercentPG, poolOBJECTSperPG, poolOBJECTSpercentPG );
  }
  printf("\n\033[1m%-50s %-14i %-6s %-14i %-6s %-14i %-6s %-8i\033[0m\n", "SUM", poolBYTESsum, "", poolOMAPsum, "", poolOBJECTSsum, "", poolPGsum)
}'
Using awk again, for the next one, it will be better to use JSON... :)
It can be copied-pasted directly from a machine with admin access to the cluster. If you regularly use this kind of command, I recommend adding it directly as an alias in your bashrc or zshrc.
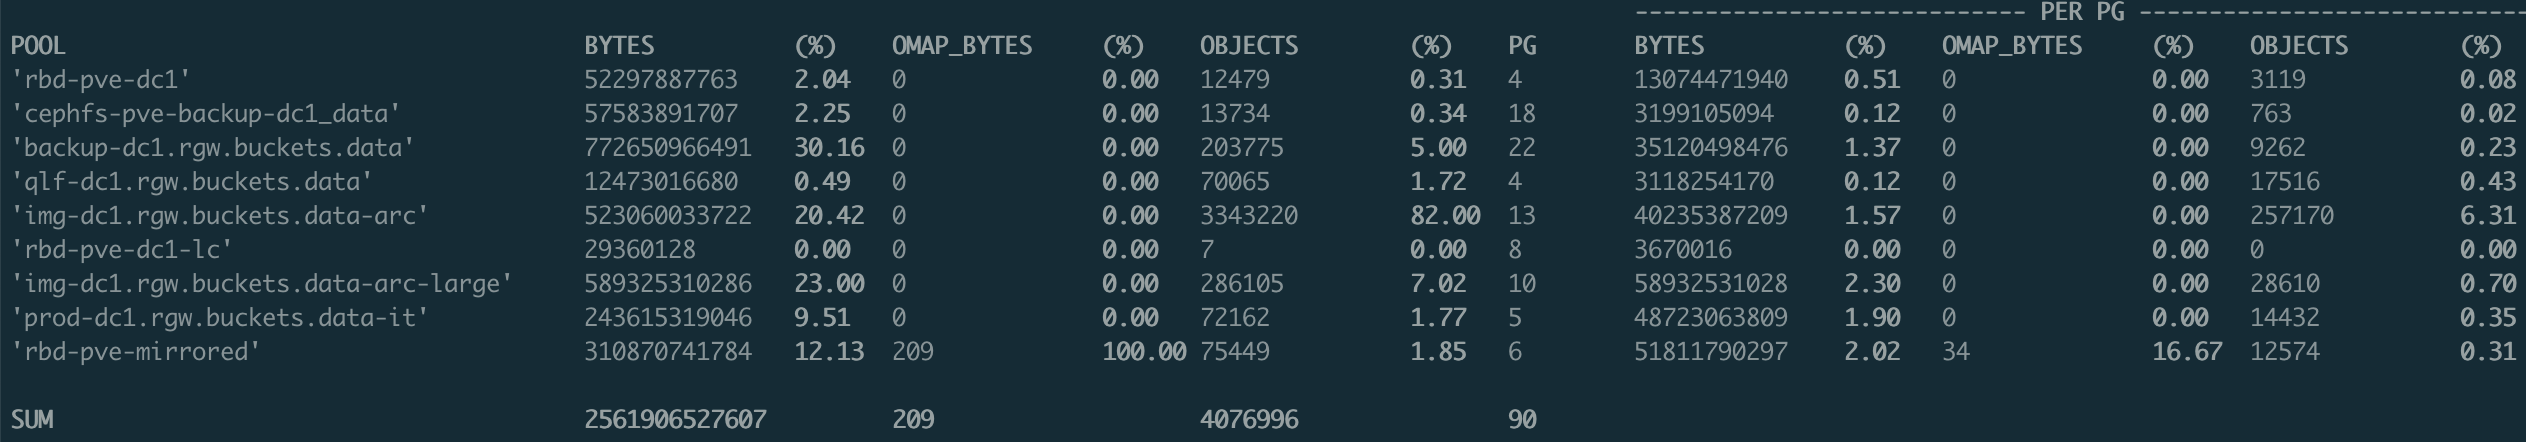
Some explainations
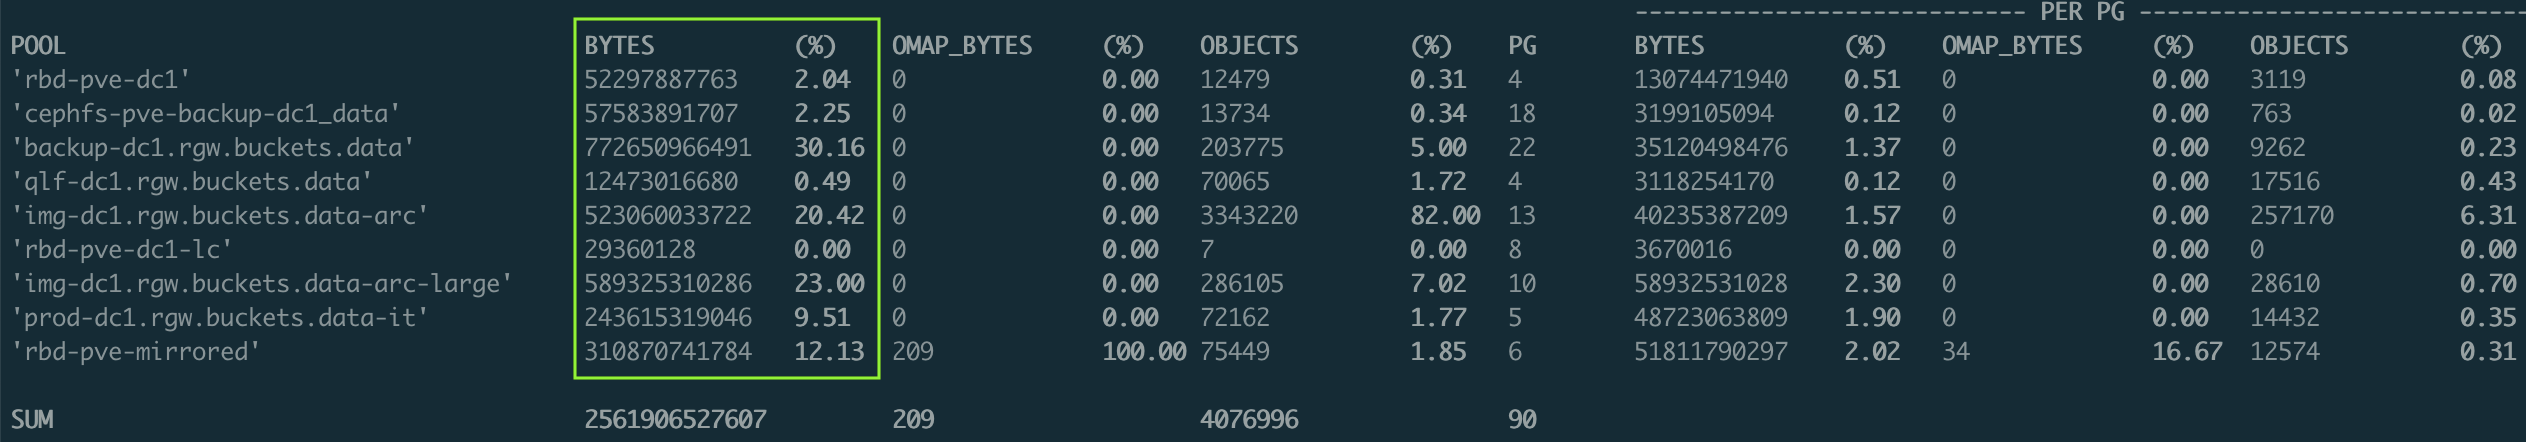
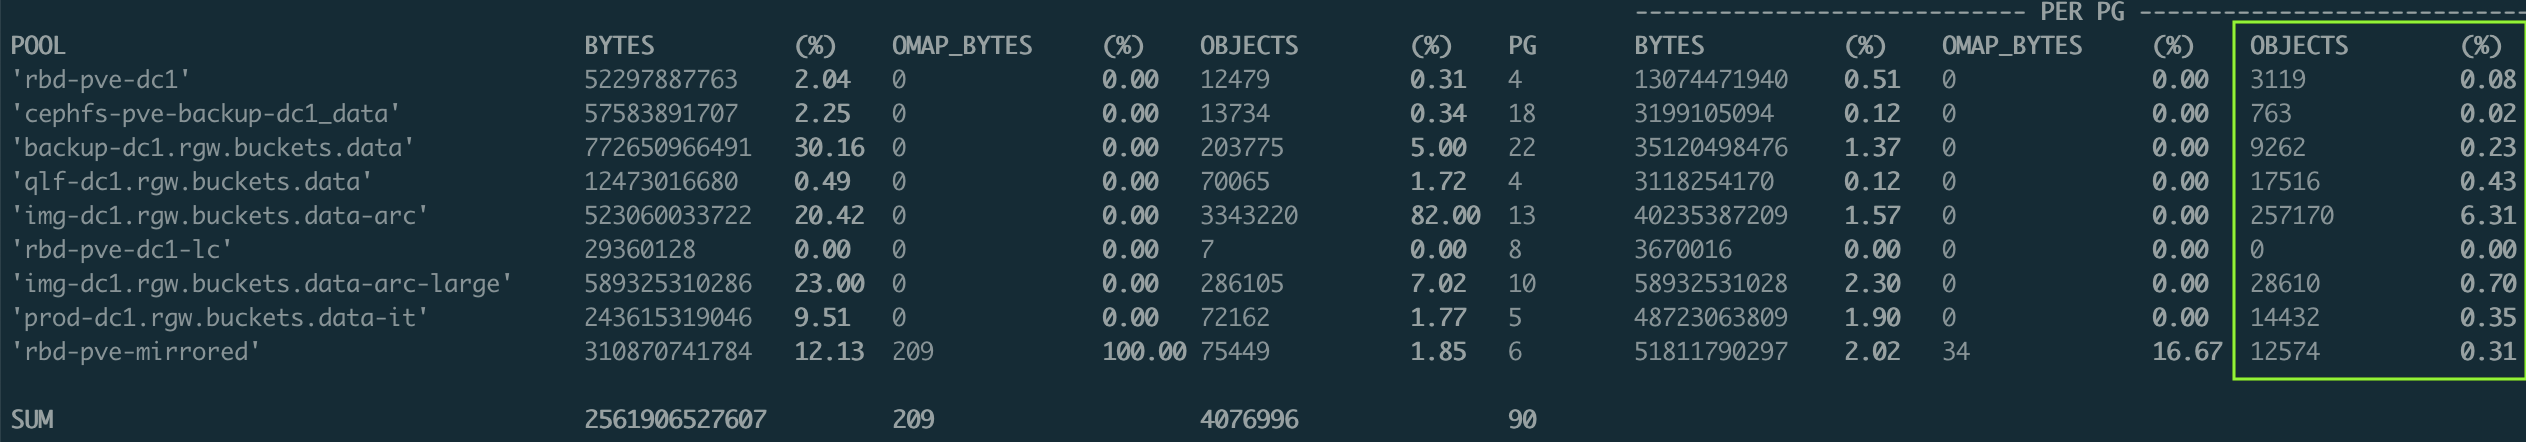
The first column represents the bytes used per pool (and the percentage of usage for each pool). This helps identify which pools are consuming the most space. Ideally, the largest pools should have the most PGs.
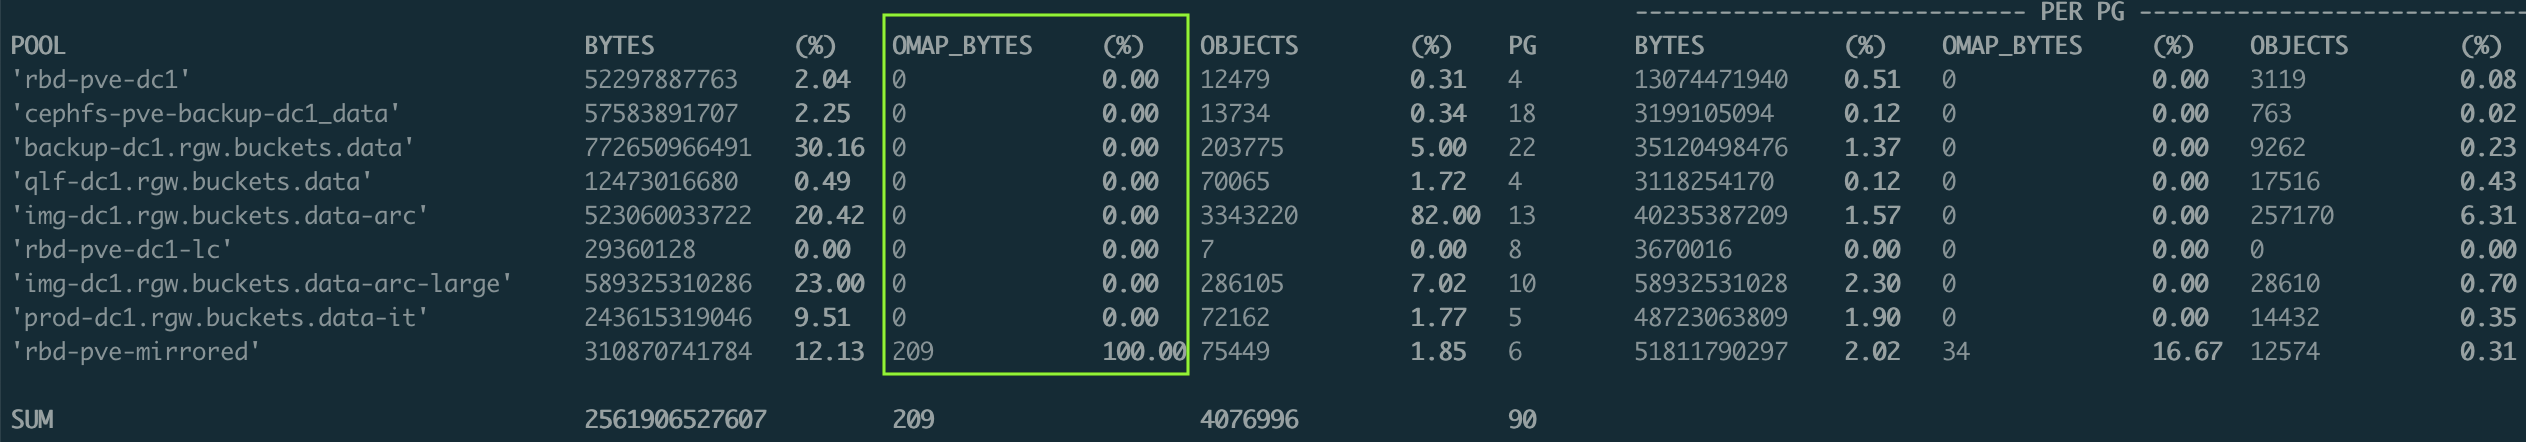
The second column shows the OMAP objects and size per pool. (In this example, there are minimal OMAPs, as they are on another storage class.) OMAP sizes are updated during deep-scrub.
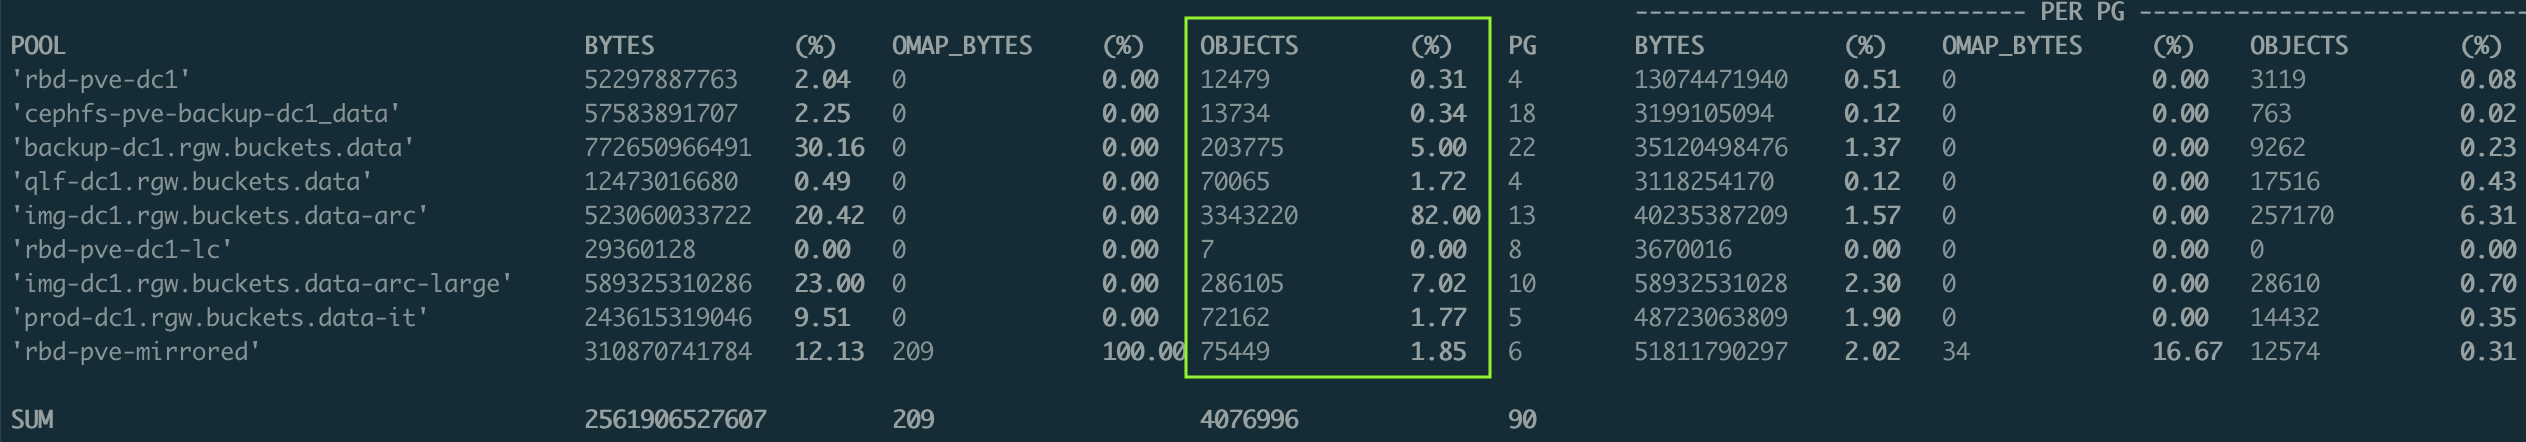
The third column displays the number of objects per pool (and the percentage). More objects generate more metadata (not shown here). Again, the largest pools should have the most PGs.
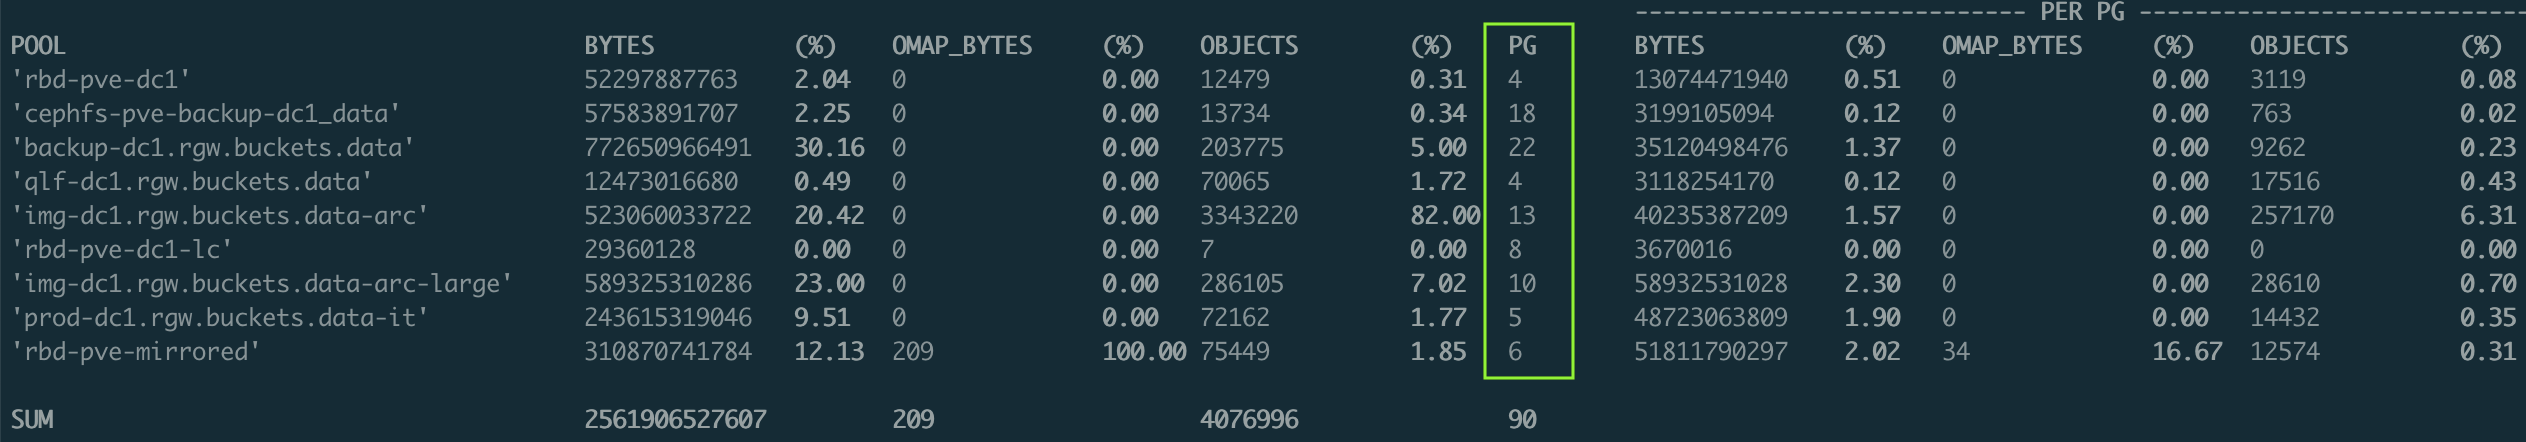
PG Column: It is a summary of the PG per pool on the current OSD.
The largest pools, whether by size or file count, should have enough PGs to ensure data is well distributed across the cluster. If you heavily use OMAP (e.g., for RGW indexes), ensure these pools are well distributed too.
This is a bit equivalent to an old post for cluster wide...
Per PG
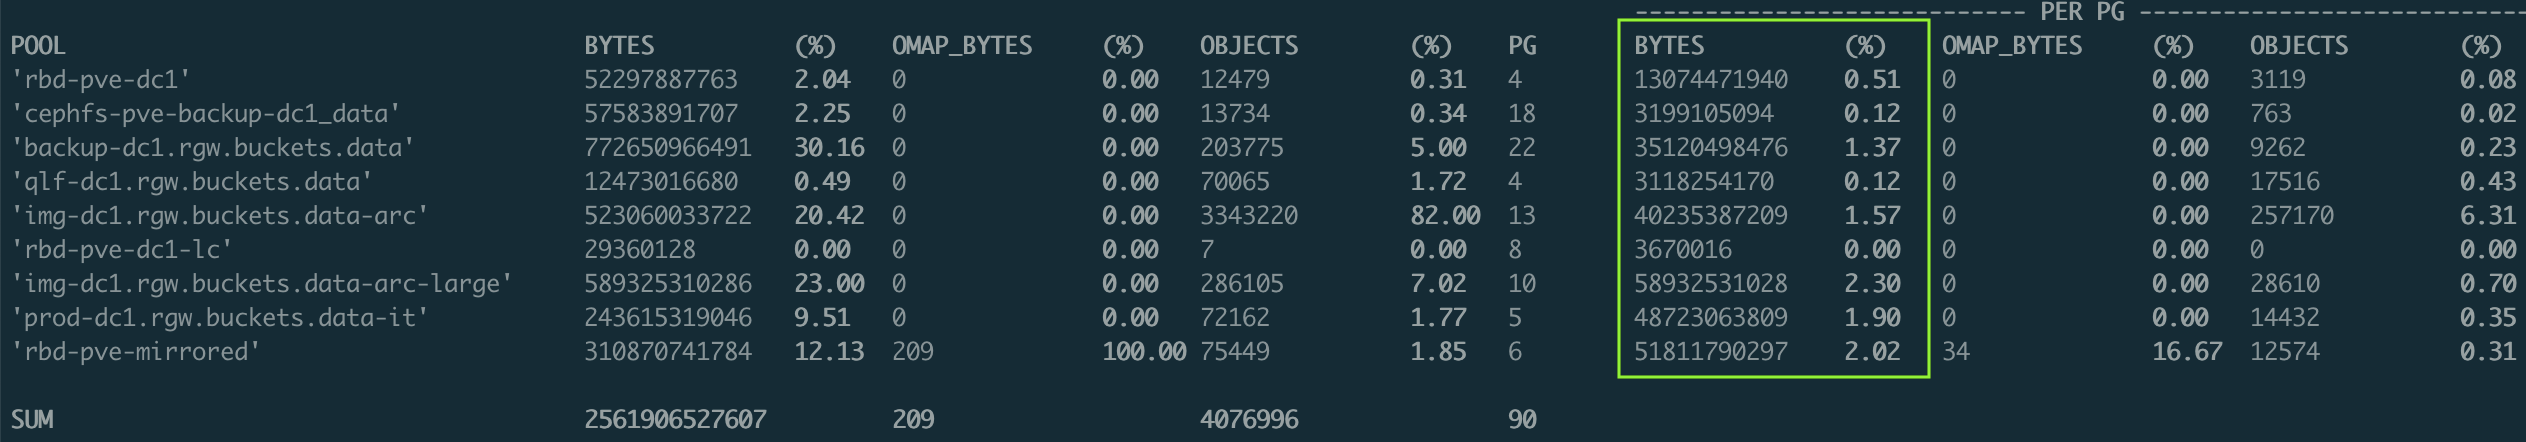
The last three columns represent the same values but per PG. The percentage indicates statistics for a single PG.
For instance, the percentage of BYTES shows the size of a PG relative to the OSD. This is the smallest movement possible when relocating it. Ideally, it should be a few percent to maintain a balanced data distribution among OSDs. If too large, consider increasing the number of PGs for this pool.
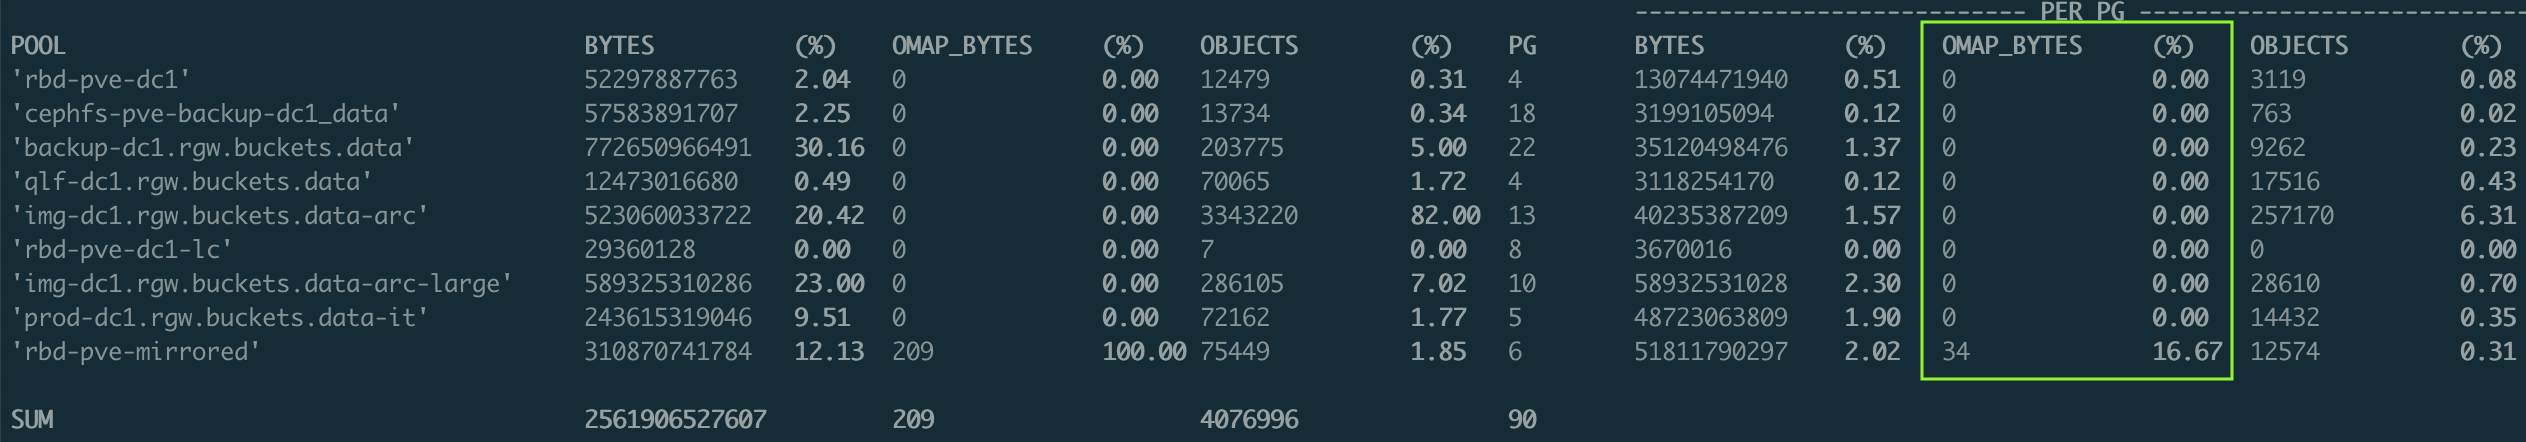
The last one show the number of objects per pg on the current OSD. This can be an indication of the distribution of metadata.
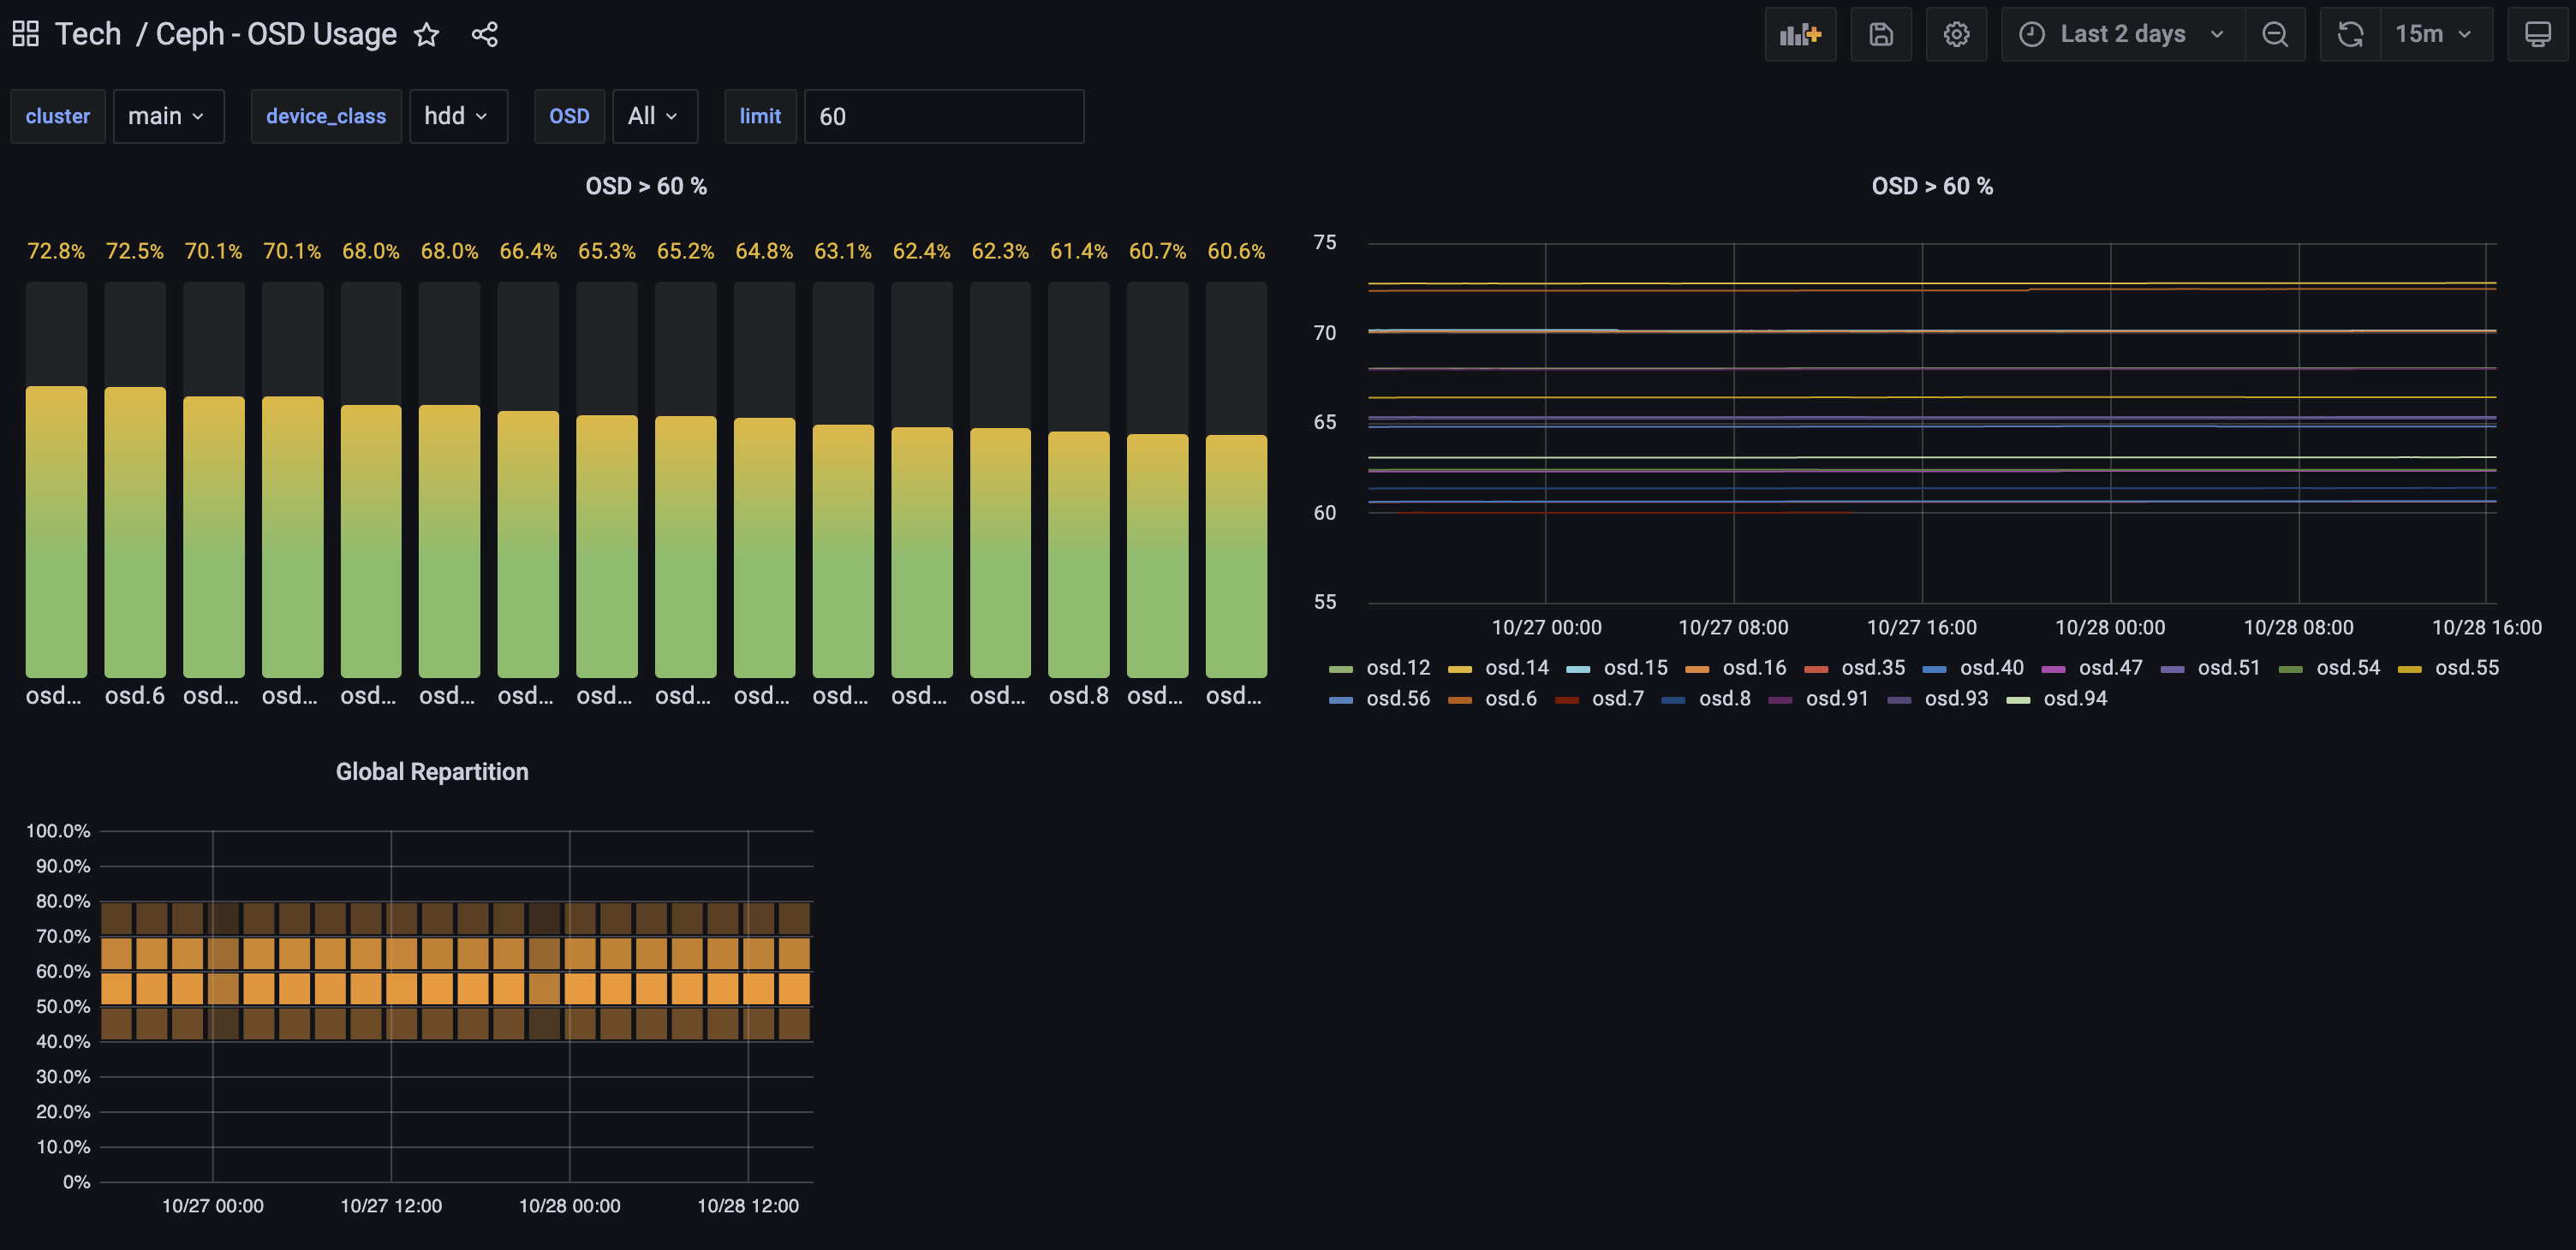
To get global OSD usage, you can use this Grafana dashboard : https://grafana.com/grafana/dashboards/17296-ceph-osd-usage/